
I have been saying for years that Intelligent Design proponents need to get serious about doing some research. The talk about information and complexity and make claims, but they can’t do it. They can’t do the work. They can’t do the calculations. They can’t even define what they need to measure, sometimes including “function”, sometimes talking about “specified”.
I wrote about this a few posts ago in regards to Meyer and Darwin’s Doubt. Meyer almost came up with an actual testable hypothesis, but still lacked a lot of the fundamental definitions and skills to make it work.
Well, Meyer and the rest, I’m sorry to say, you’ve been scooped. Some actual scientists, doing actual science, have actually defined complexity (in several ways), determined how to measure it (in terms of information content), then examined how it changes with evolution. Sorry guys, but you aren’t going to like this.
There’s no easy, gentle way to say this. You are simply wrong.
There are two papers to talk about.
http://www.ploscompbiol.org/article/info%3Adoi%2F10.1371%2Fjournal.pcbi.1002236#close
http://www.ploscompbiol.org/article/info%3Adoi%2F10.1371%2Fjournal.pcbi.1003111#close
These two papers describe a rather complex experiment and provide a lot of detail about how complexity is computed. I’ll try to be brief. If you want the math, then go to the papers… I’m not going to try to recreate it here.
The problem with determining complexity is we have to figure out how to measure whatever it is we’re including in our complexity measure. We also have to justify what is included in a complexity measure and what isn’t included. In terms of ID, this appears in two places. What do we measure (DNA, proteins, parts, pieces, the whole) and this has never been answered by any ID proponent. The second is how we measure it. There’s a relatively new trend in pro-ID circles to talk about “function”. The problem is that no one can measure function.
In terms of just DNA sequences, the DNA for normal hemoglobin and sickle-cell hemoglobin are exactly the same length and with only one nucleotide difference. There function is even the same. Except that the sickle-cell allele is less effective at carrying oxygen, but it’s more effective at resisting malaria. How do we incorporate that into our complexity computation? Until ID proponents can do that, then all they are doing is talking and that’s not science.
Once again, scientists have done what ID “scientists” won’t do. In this case, seriously examine a method for computing complexity and then examining that complexity in an evolving system.
The result is very simple. Complexity increases.
This first diagram shows the maze (A) and the ‘bugs’ that were tested (B).

The maze is actually much longer and repeats, but this just gives you an idea about it. The bug has six sensors (0-5). Sensor 3 only looks at the symbol in the door way (shown as the red arrows in the maze). When in a doorway (and only in a doorway), sensor 3 can tell if the next door is forward or up or downward. Once the bug leaves the door, that sensor doesn’t remember where the door is. The bugs have to evolve memory.
Circles 6-9 are logic units and can potentially act as memory. The legs are 10-11 and can move the bug forward, up, down, or not move the bug.
The authors used a ‘genome’ that told the bugs what things were connected in what way. Then the program was run with 300 bugs. The 10 bugs that went the farthest in the maze each got to have 30 offspring some of which had mutations. Due to a desire to track the history of the organisms and the internal changes, crossing over and sexual selection were not allowed (poor bugs).
What were the results? Well, a few of the first bugs actually made it to the first door. Forty nine thousand generations later, the bugs were reliable charging through the maze with ease. They had evolved a memory, so the bugs could remember which direction the next gate was (by the clue in the door way) and they didn’t randomly root around for a door way.
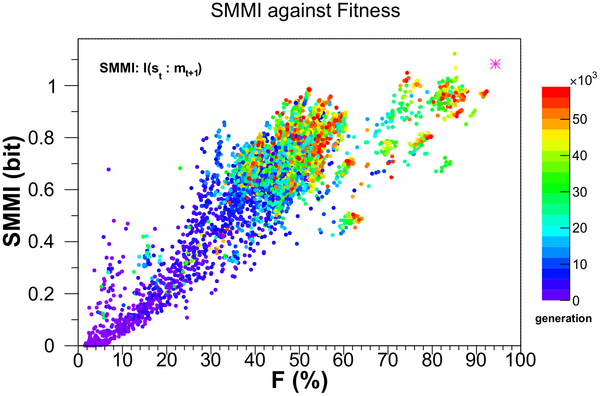
This diagram tracks the Sensory-Motor Mutual Information (SMMI) versus fitness. The SMMI tracks the average information transmitted from the sensors to the motors between time stamp t (when the sensor registers the input) and the activity of the motors at t+1. The color diagram on the right shows the generations of the bugs. The magenta star in the upper right is the score of a human designed bug that was tested in the mazes.*
Note how the complexity increases as fitness increases.
Indeed, in any of the several varieties of complexity measure, the complexity increases as fitness increases.
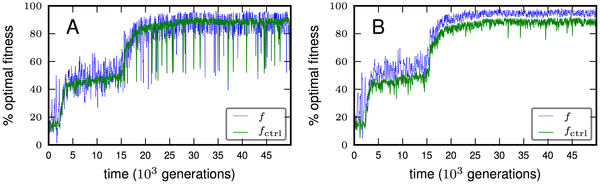
These two diagrams show something very interesting as well. As the fitness increases over time, it’s not a constant rate. In fact, these two diagrams show an almost perfect example of punctuated equilibria.
Just one more graph here.
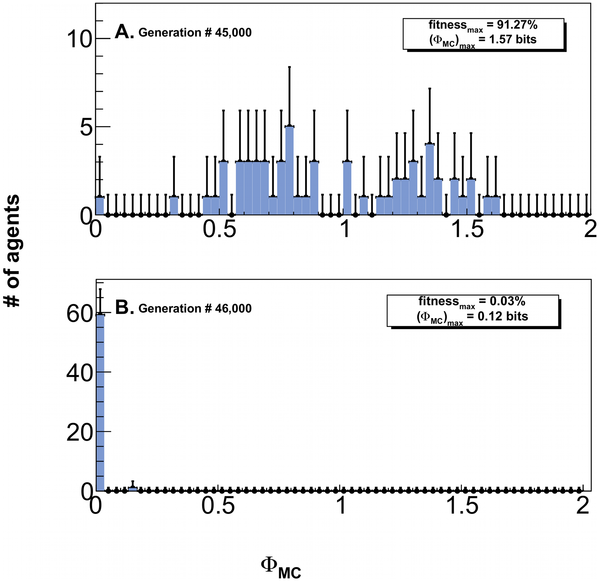
This is what happens to complexity and fitness when you remove the concept of natural selection. Instead of taking the best of each trial to reproduce for the next trial, in these graphs, random bugs were allowed to reproduce.
This, very simply, shows that random mutation and natural selection are sufficient to increase the complexity and information in a population of organisms over time.
These papers are simply stunning pieces of work.
_____________________________________
* I find this very interesting in that it’s one of the few evolution by genetic algorithm experiments in which a designed bug was better than the final evolved versions. I do wonder what would have happened had the experiment gone another 10,000 generations.