
We all knew that this was coming, but I wanted to wait for NASA’s Goddard Institute for Space Studies and NOAA to make it official. And now it is.
2014 was the hottest year in 134 years of global temperature records. December 2014 was the warmest December in the 1880 to 2014 period by two hundredths of a Celsius degree.
This pushes 2004 off the top ten chart. That’s the NOAA list, which varies slightly from other lists because of the baseline chosen. But all lists (including Japanese and English) have 2014 as the warmest year on record.
The current top ten list, from warmest to coolest (and when I say coolest, the lowest positive anomaly):
- 2014 +0.66ºC anomaly
- 2010 +0.65ºC anomaly
- 2005 +0.65ºC anomaly
- 1998 +0.64ºC anomaly
- 2013 +0.62ºC anomaly
- 2003 +0.62ºC anomaly
- 2002 +0.61ºC anomaly
- 2006 +0.60ºC anomaly
- 2009 +0.59ºC anomaly
- 2007 +0.59ºC anomaly
Notice a few things here.
- Three of the top five (including the two hottest) are within the last 4 years.
- Nine of the top ten are within the last 12 years
Another interesting factor is that the El Niño effect, which tends to make years warmer, was not present in 2014.
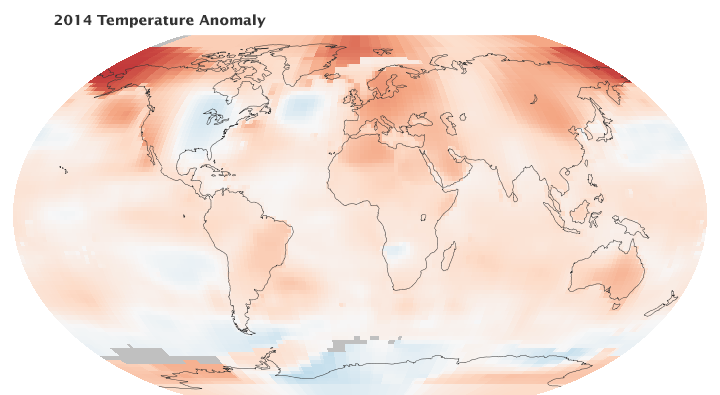
This map shows the temperature anomaly for 2014.
![]()
Much of the continental US had some minor cooling effects. This was probably largely due to the so-called “Polar Vortex” which brought unseasonably cold weather to much of the eastern US. My own home in Texas, for several days, had 10 degree (F) lower temperatures than Alaska.
That cold air, which normally stays around the North Pole, came south. The rest of the world, except for Antarctica, saw generally warmer temperatures.
In fact, the Antarctic saw some record breaking sea ice coverage, exceeding 20 million km^2 for the first time since 1979.
But the news isn’t all good. NASA scientists also announced that the Amundsen Sea region of the West Antarctic Ice Sheet has entered what appears to be an unstoppable decline. How is that possible? Well, unlike the Arctic, the Antarctic is mostly land ice. That is, under those kilometers of ice is land. The Arctic is almost completely sea ice (floating on the ocean).
Where the Antarctic is like the Arctic are the ice sheets. These are areas where large glaciers come together into the sea. What’s happening in Antarctica is that these massive glaciers, while appearing to grow on the surface, are being undercut by warmer water. Similar (but not exactly) to how a waterfall undercuts the rock and steadily moves backward. Both videos from NASA.
This NASA video shows this with some truly gorgeous graphics
What this means is that the ends of those glaciers are unstable, cracking, and forming icebergs. As the shelf gets thinner and the grounding line moves farther back, the entire thing becomes unstable and could break off. This has been a concern and a known issue since about 1973.
The Amundsen Sea region alone contains enough ice to raise global sea levels about 4 feet. The IPCC report predicts that global sea level will rise between 1-3 feet by 2100. But that doesn’t include any changes from a massive glacier collapse event, like the Amundsen Sea.
If the entire West Antarctic Ice Sheet melted, it would raise global sea level by 16 feet (4.8 meters).