
Having recently read a diatribe by one atheist public figure accusing another atheist public figure of having damnably bad ideas about the legal age of consent (no idea whether that accusation can be made to stick) I thought that now might be a fine time to try to visualize how those laws have shifted over the years here in the U.S.
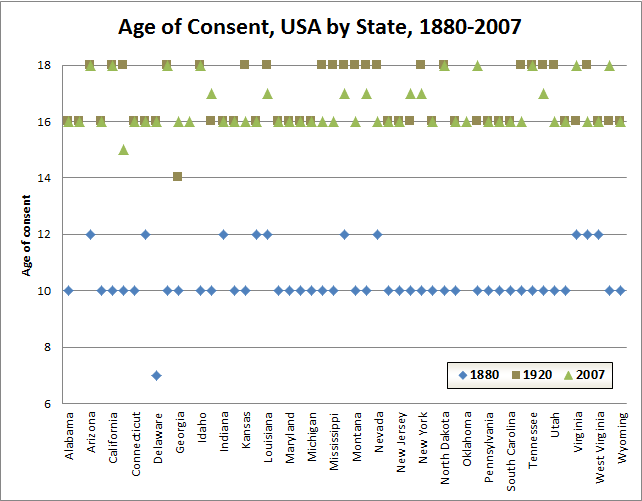
The source data table may be found here, for those interested. It seems that the major shift was mostly due a nationwide reform campaign from the 1880’s until 1914, a campaign which might well be aptly characterized as a progressive women’s movement roughly contemporaneous to the movement for temperance (read: prohibition). Unlike the laws outlawing alcohol, the changes wrought by age-of-consent reformers remain with us, even in Delaware.
EDIT: I am aware that these data are somewhat oversimplified, leaving out the complexities of close-in-age exceptions and the numerous discriminatory laws which treat homosexuality and hetersexuality differently, along with various other exceptions. Such is the way of things when you’re trying to squeeze over a 140 different statutes into a single chart.